Overview
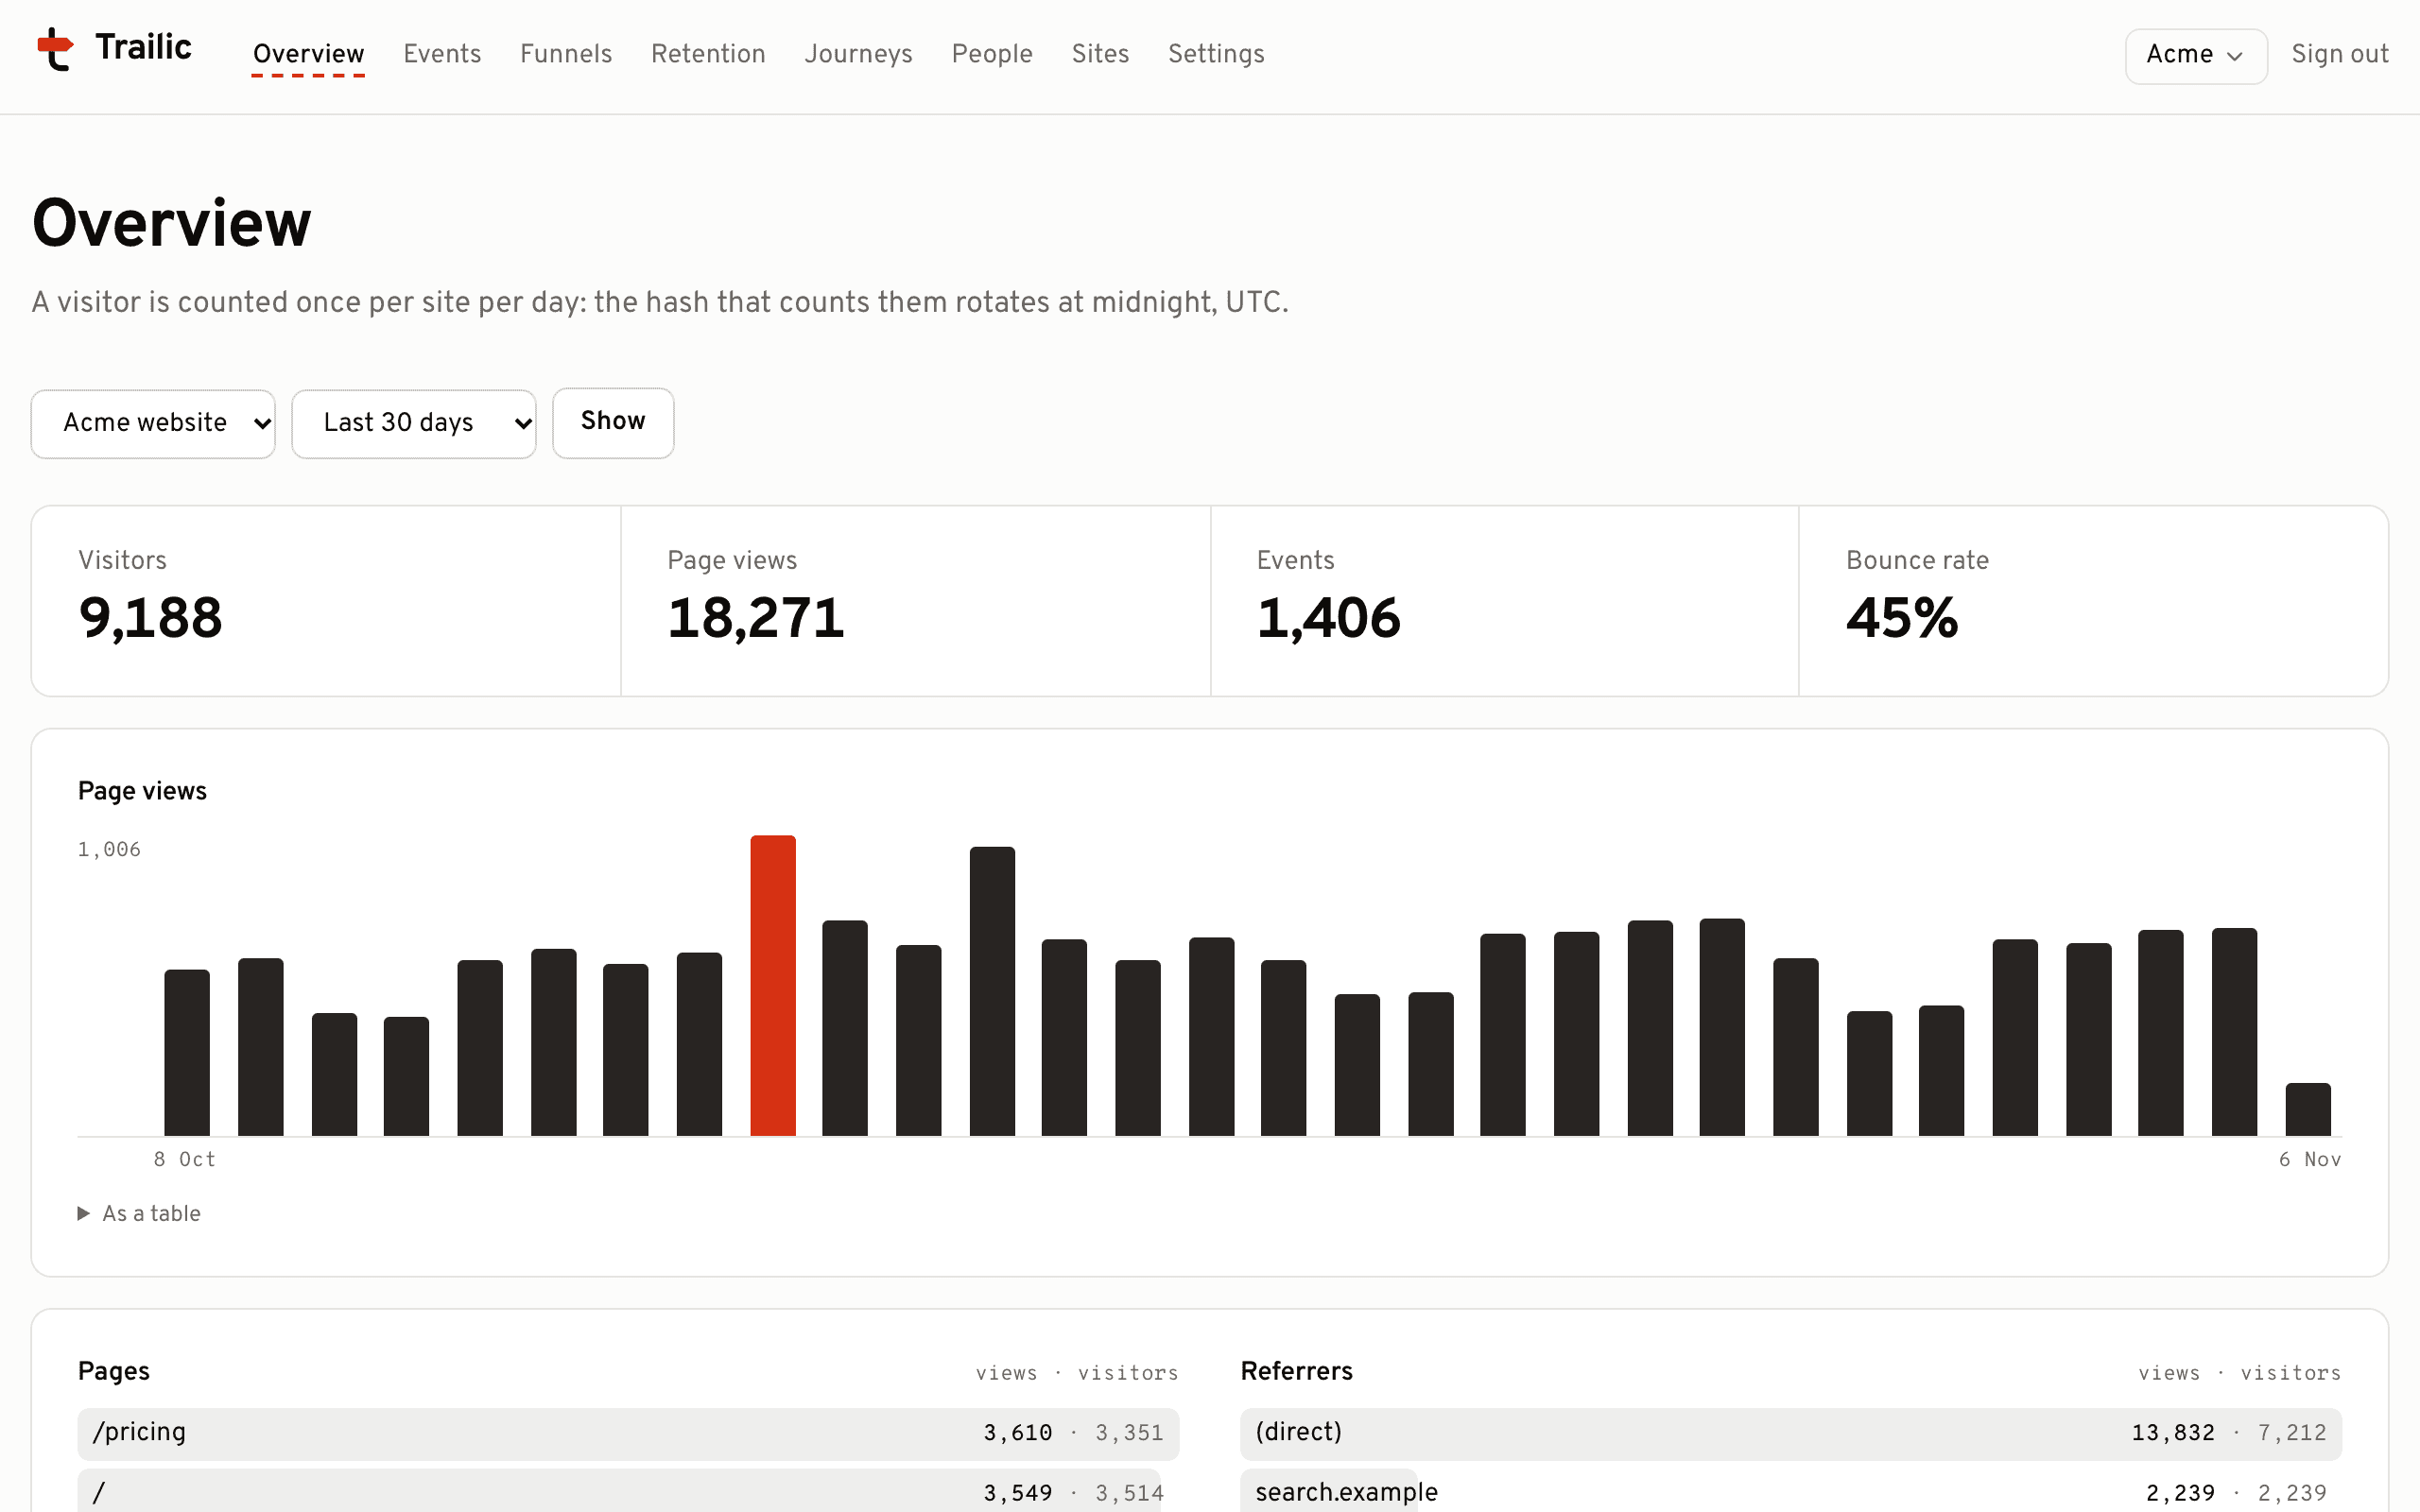
Per site or across a workspace: visitors, page views, events, bounce rate, a chart per day, top pages, referrers, UTM tags, countries, devices, browsers, systems, and web vitals if you send them.
Features
Everything on this page exists in the repo and runs on a test instance. It hasn’t met real traffic yet. What’s still missing is listed at the end.
packages/trailic, about 1.5 KB gzipped, with React as its only peer. Events wait up to 5 seconds, or until there are 10, and go in one request. A collector that’s down changes nothing on the page: every failure is swallowed, and nothing is retried.
The package isn’t on npm yet: for now it’s built from the repo.
Per site or across a workspace: visitors, page views, events, bounce rate, a chart per day, top pages, referrers, UTM tags, countries, devices, browsers, systems, and web vitals if you send them.
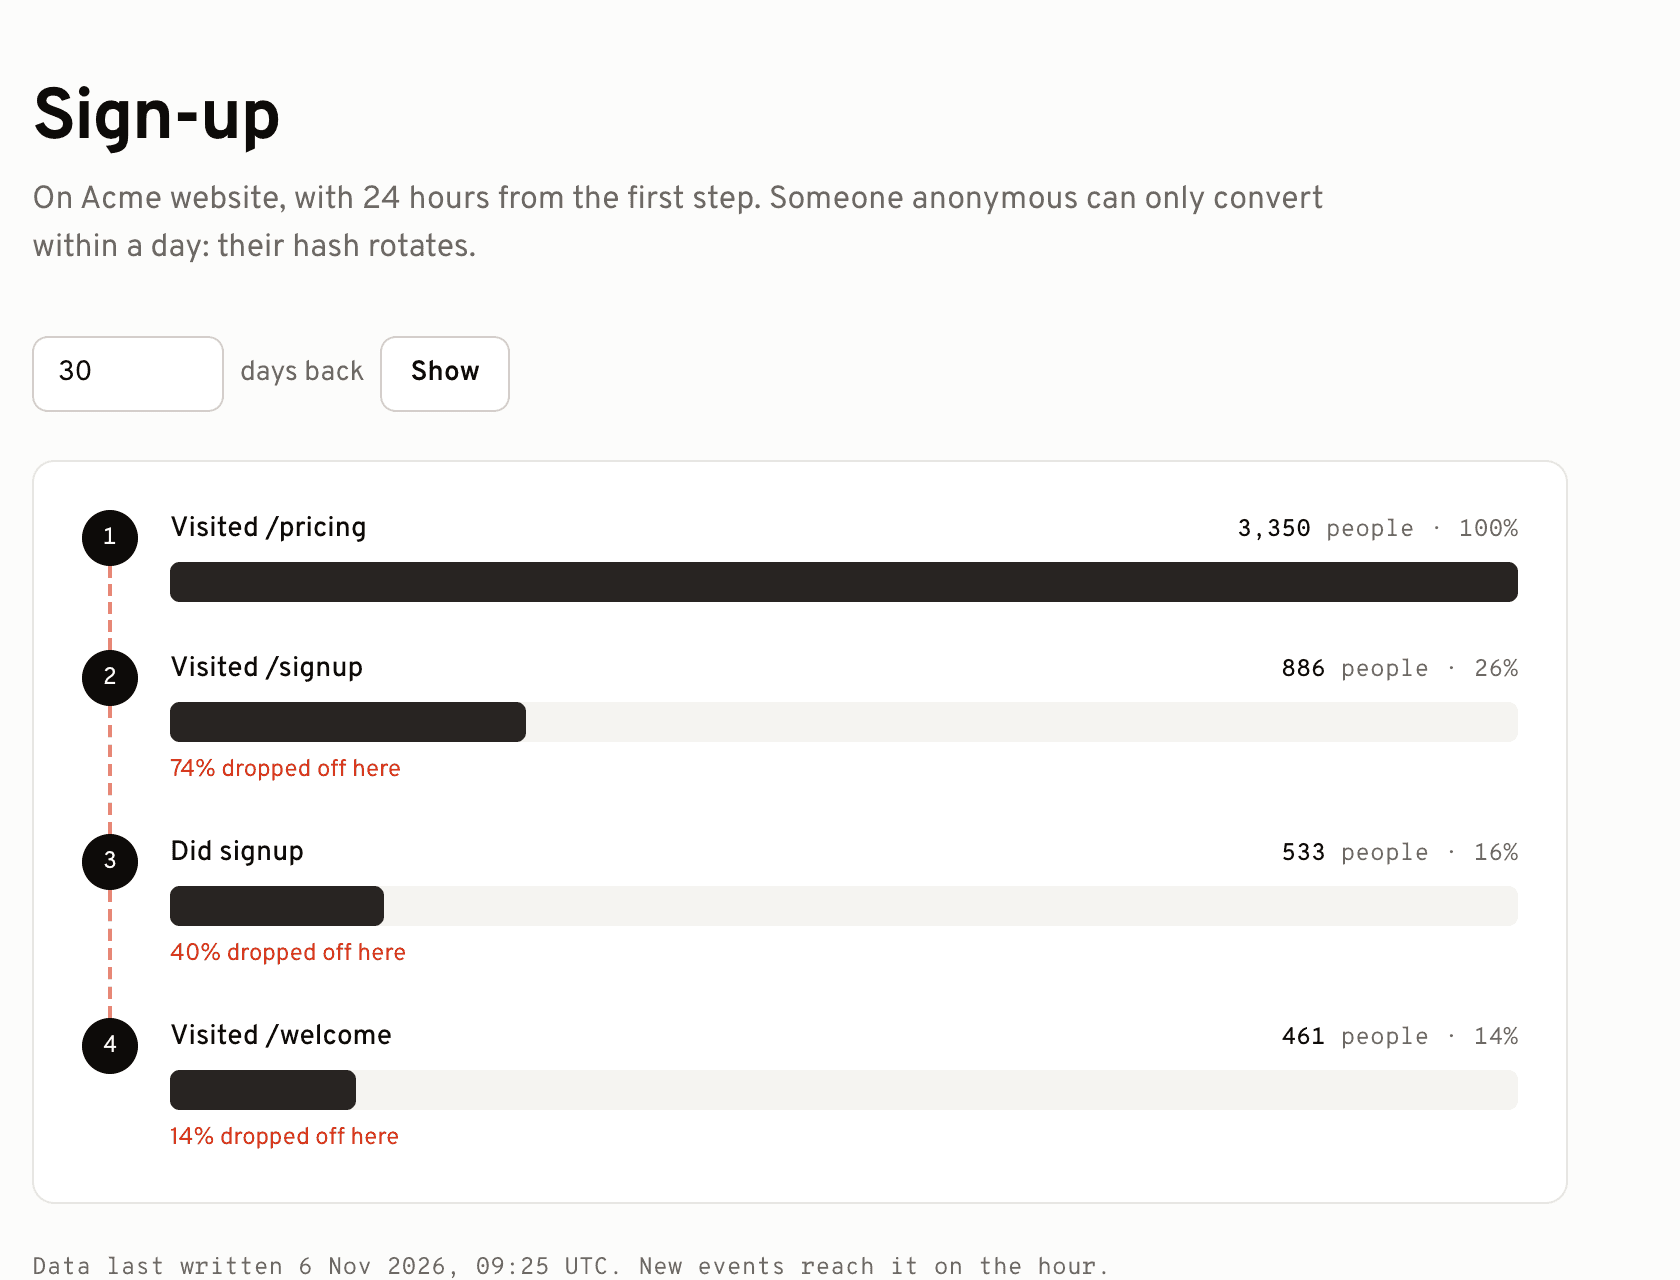
Two to eight steps, each a page (a trailing * matches anything under it) or an event, and how long people have from the first step.
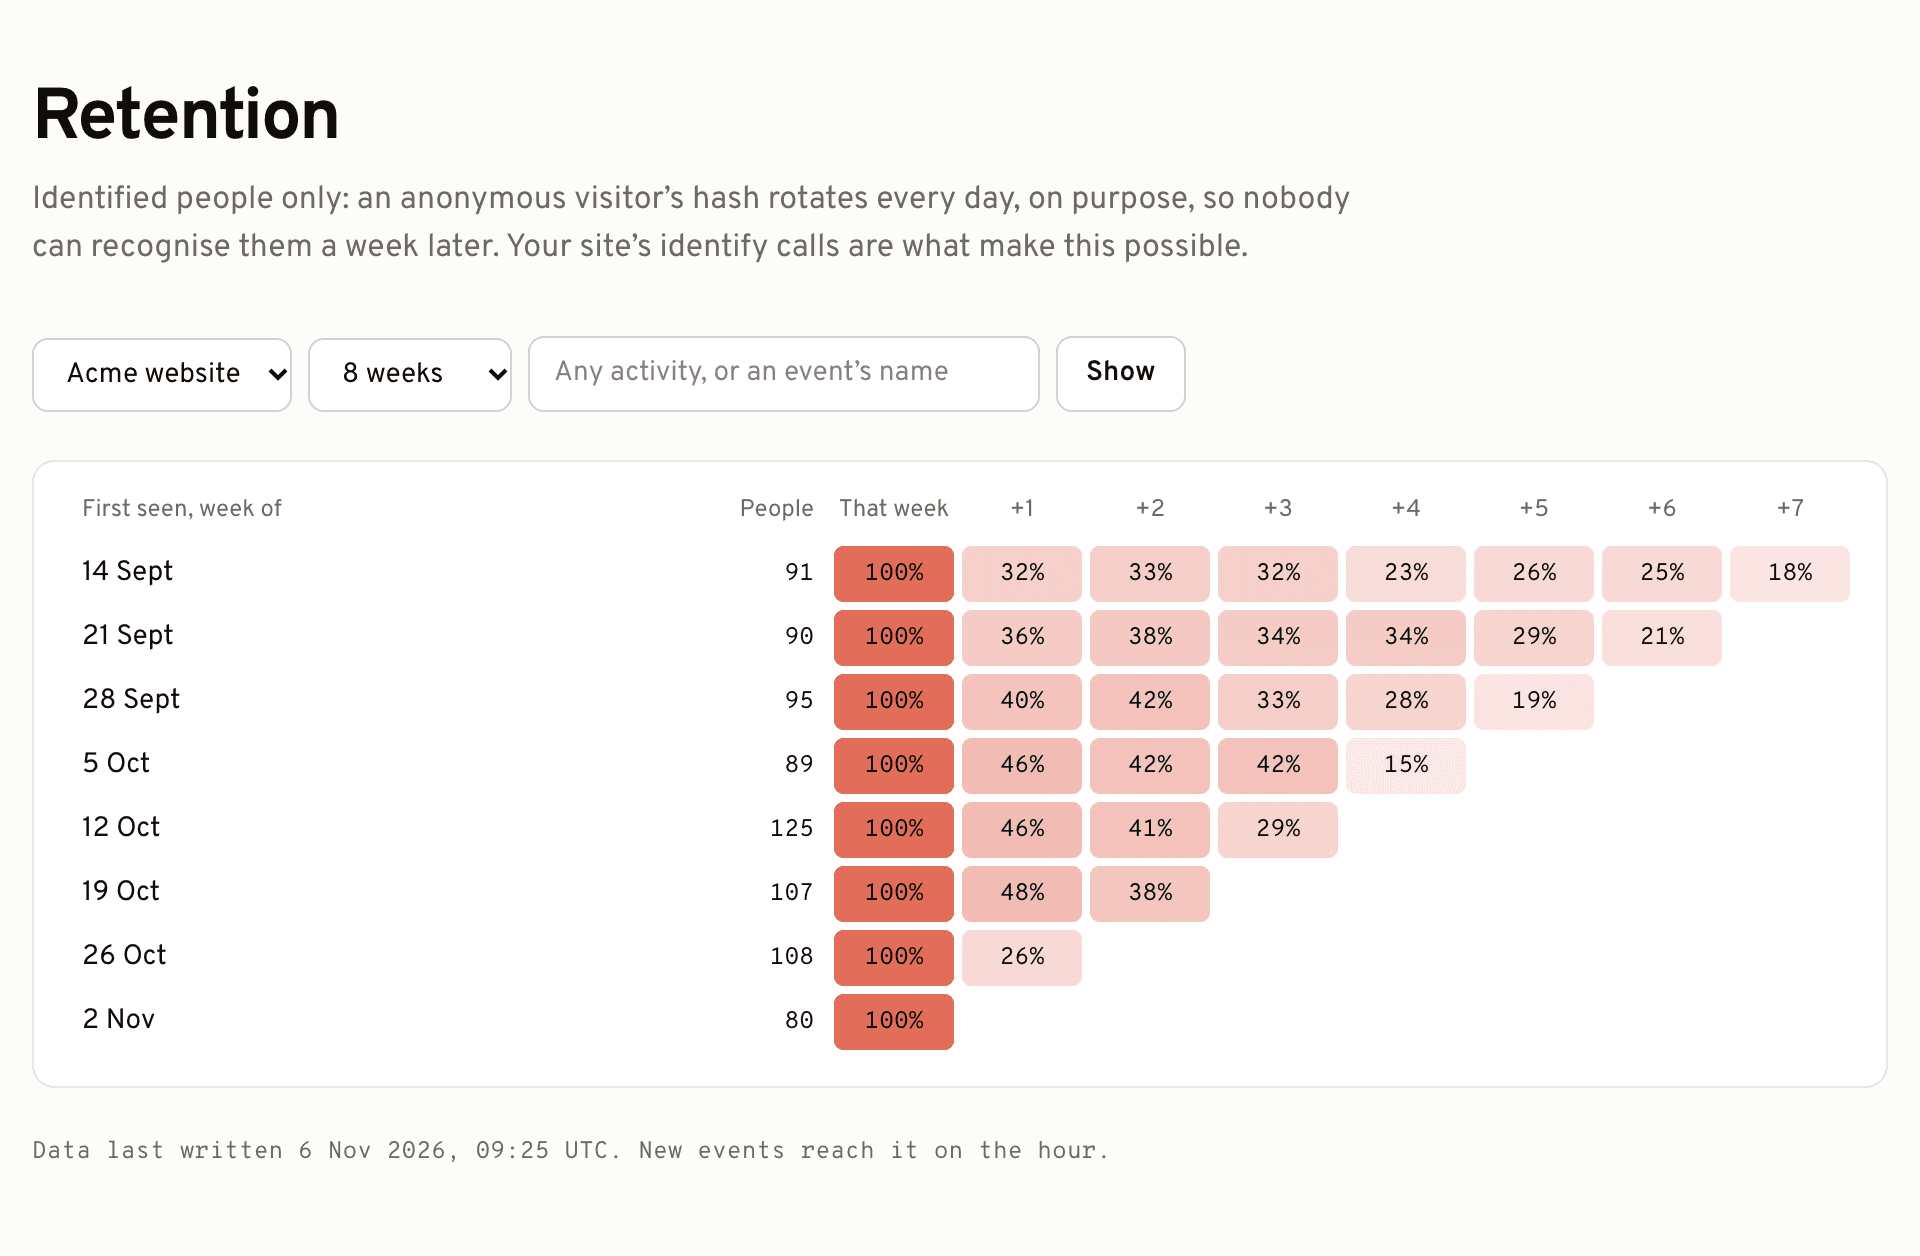
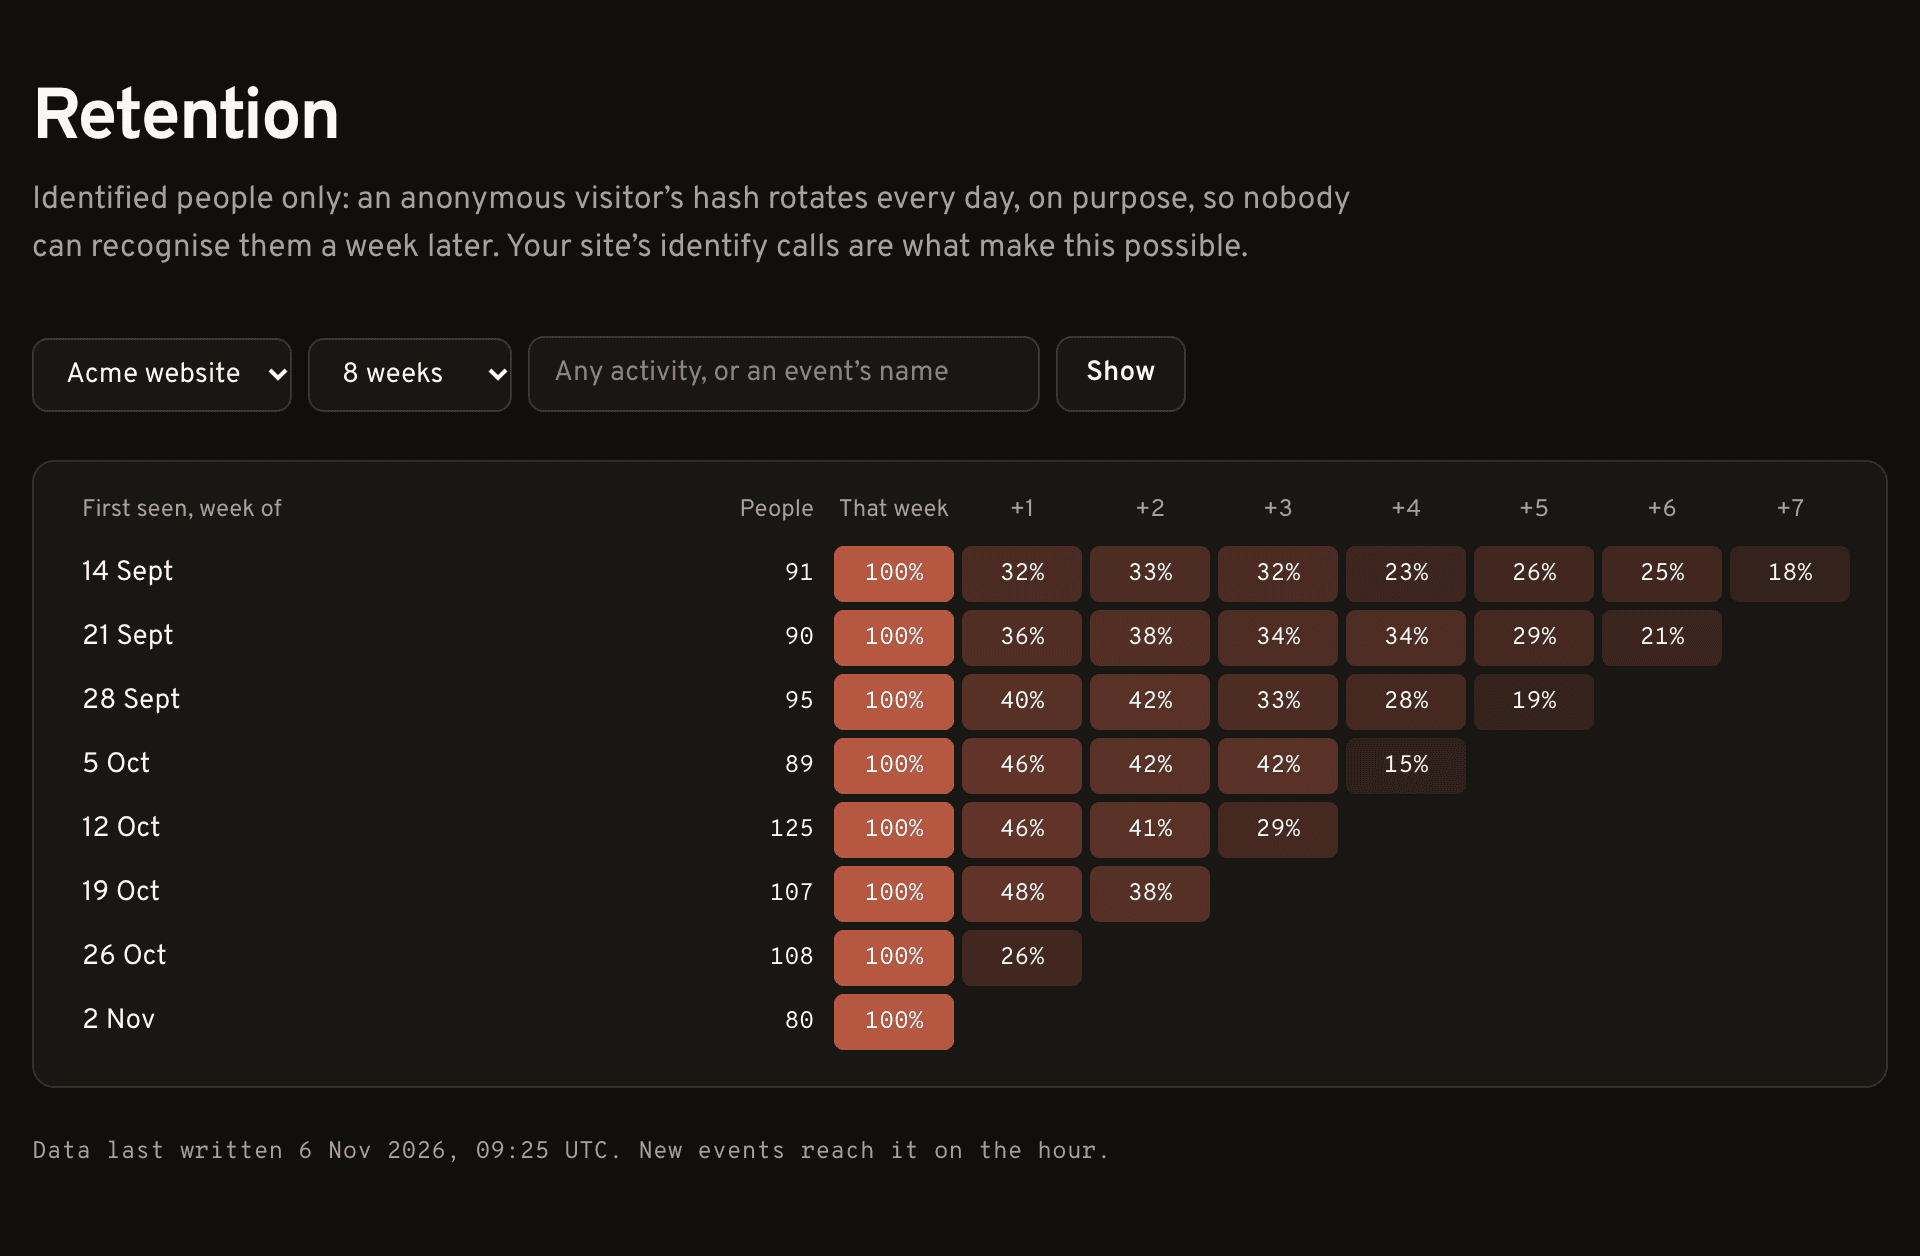
Cohorts by the Monday of the week someone was first identified, and what share came back each week after, by any activity or by a chosen event.
From a page: each visitor’s first time on it that day, and the next three pages within half an hour, most common first.
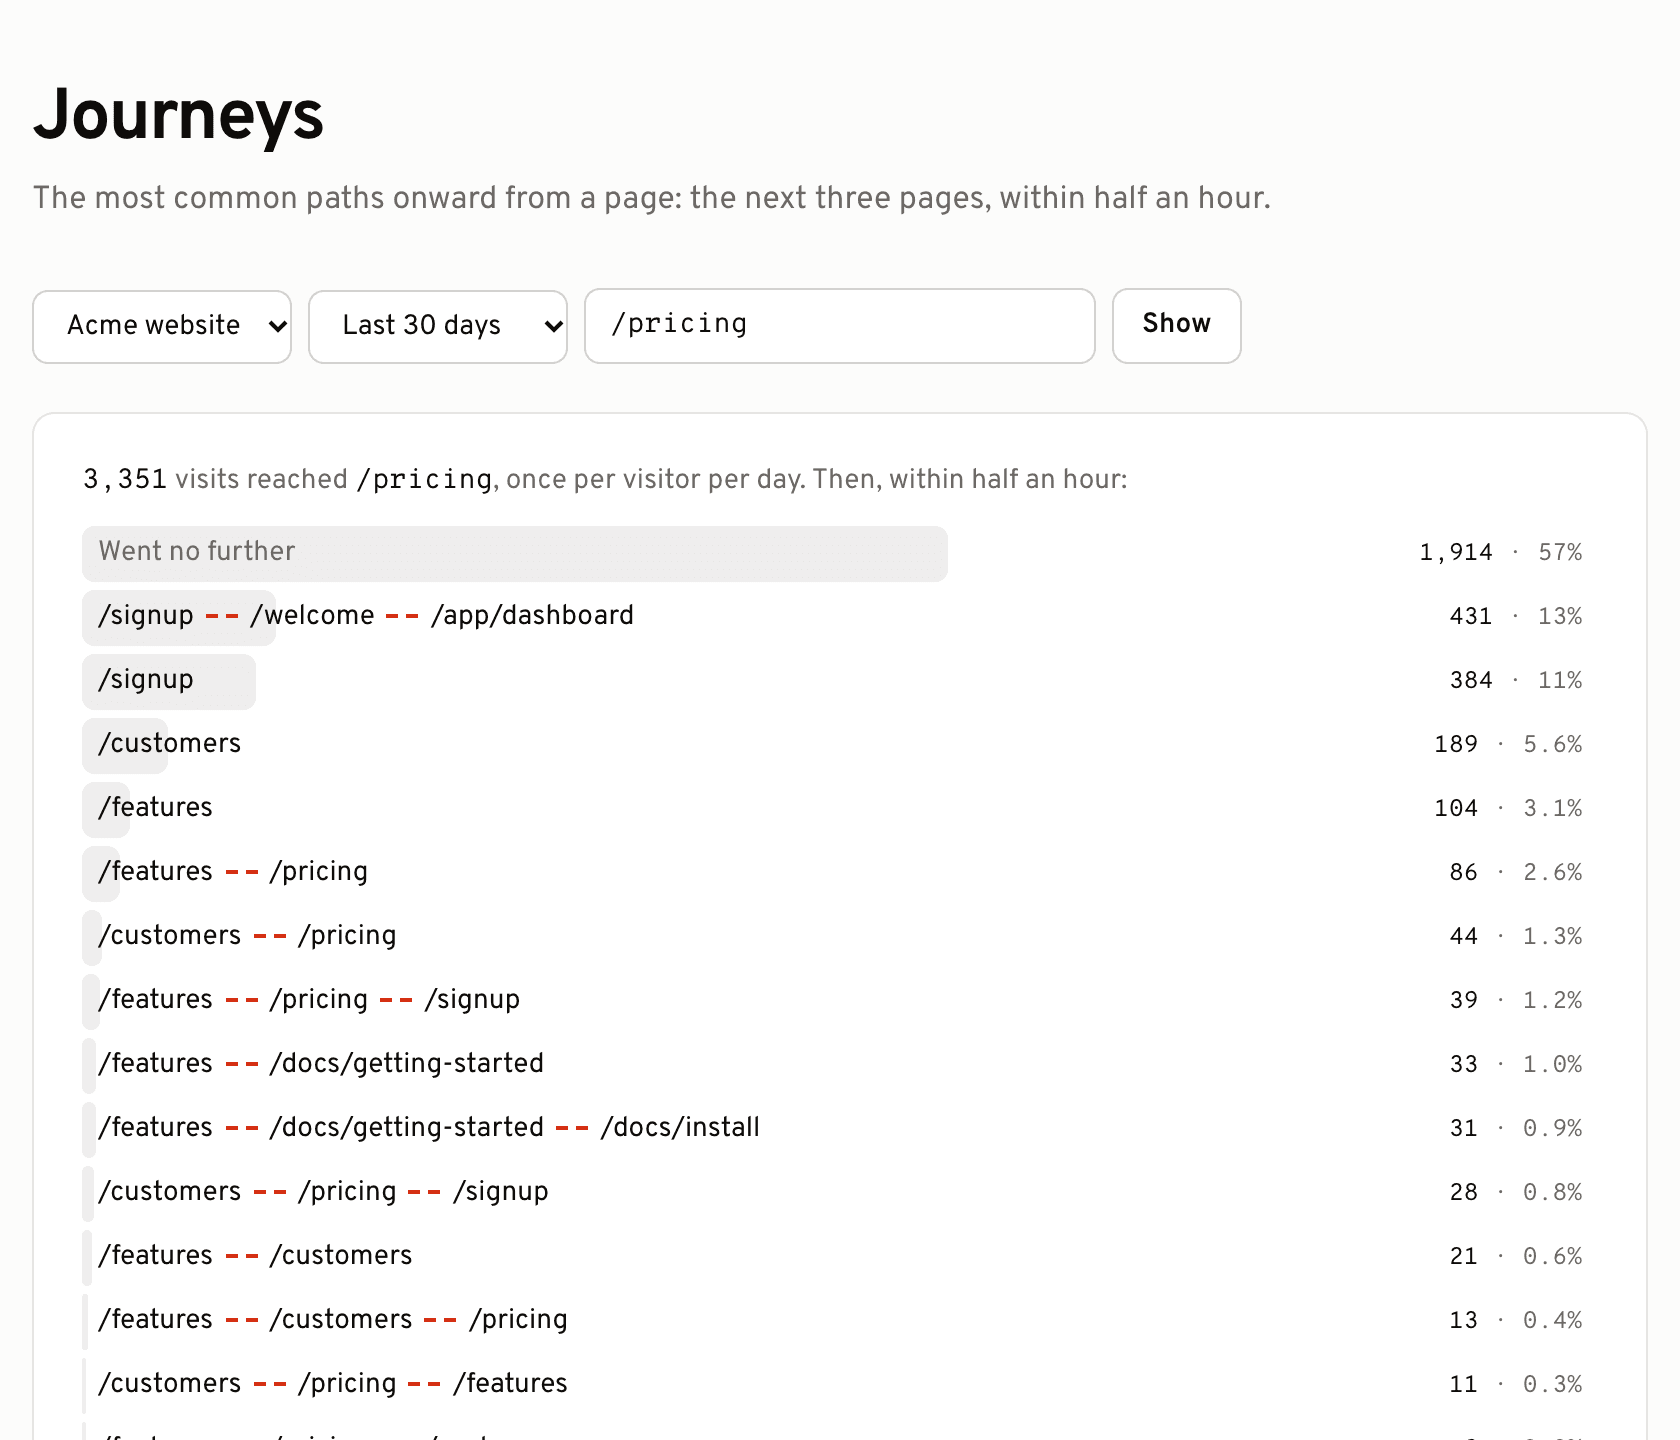
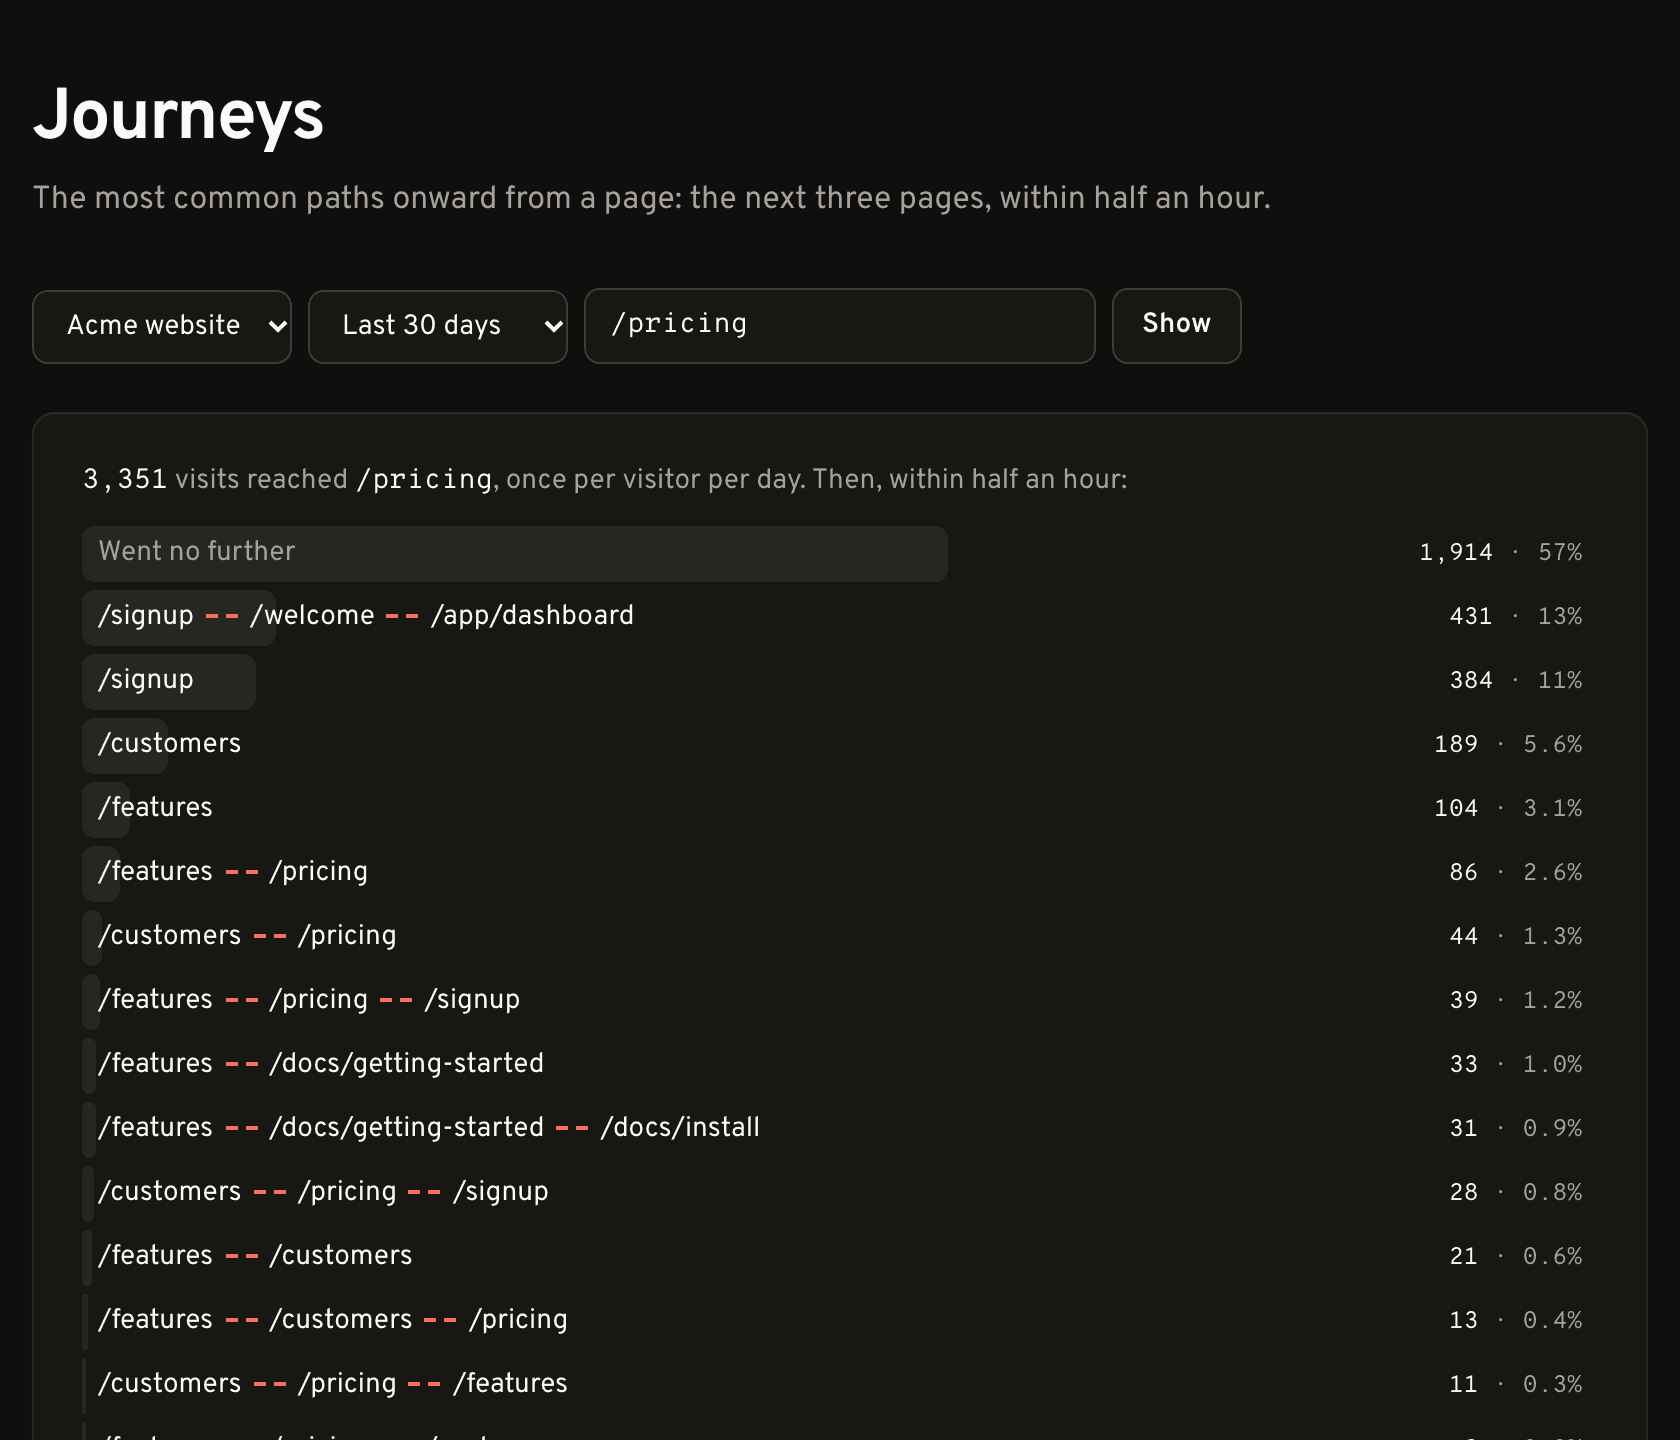
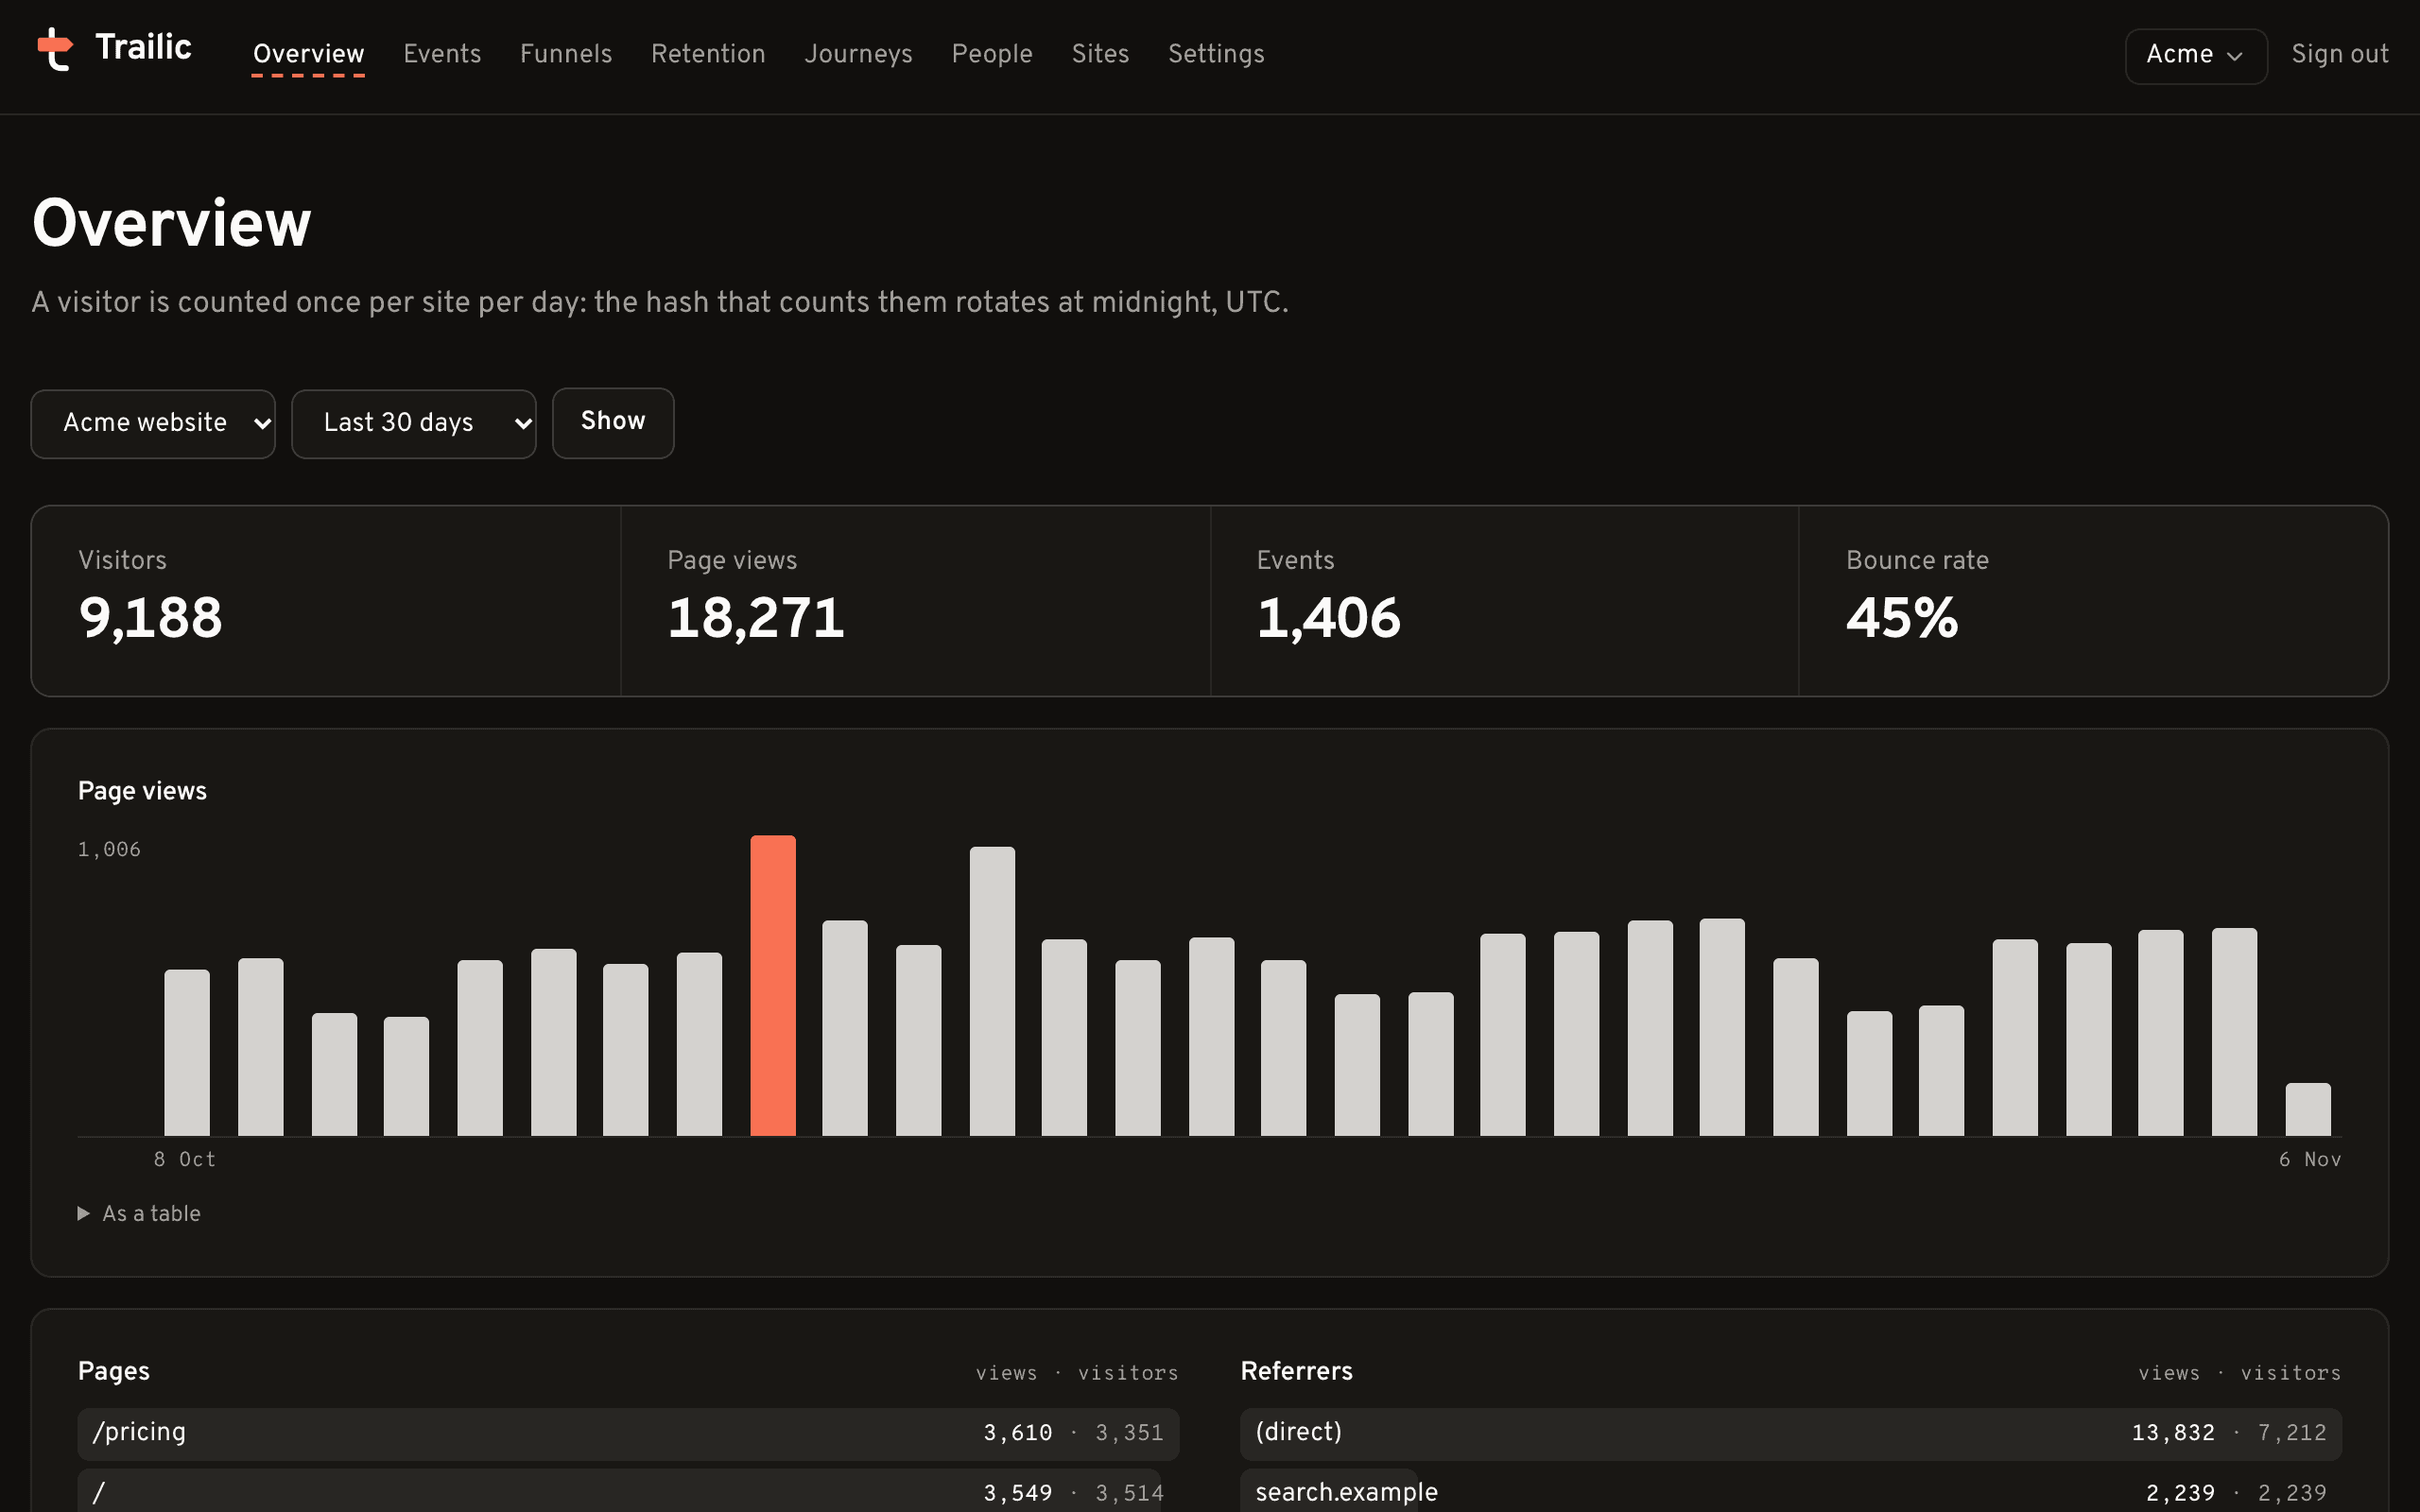
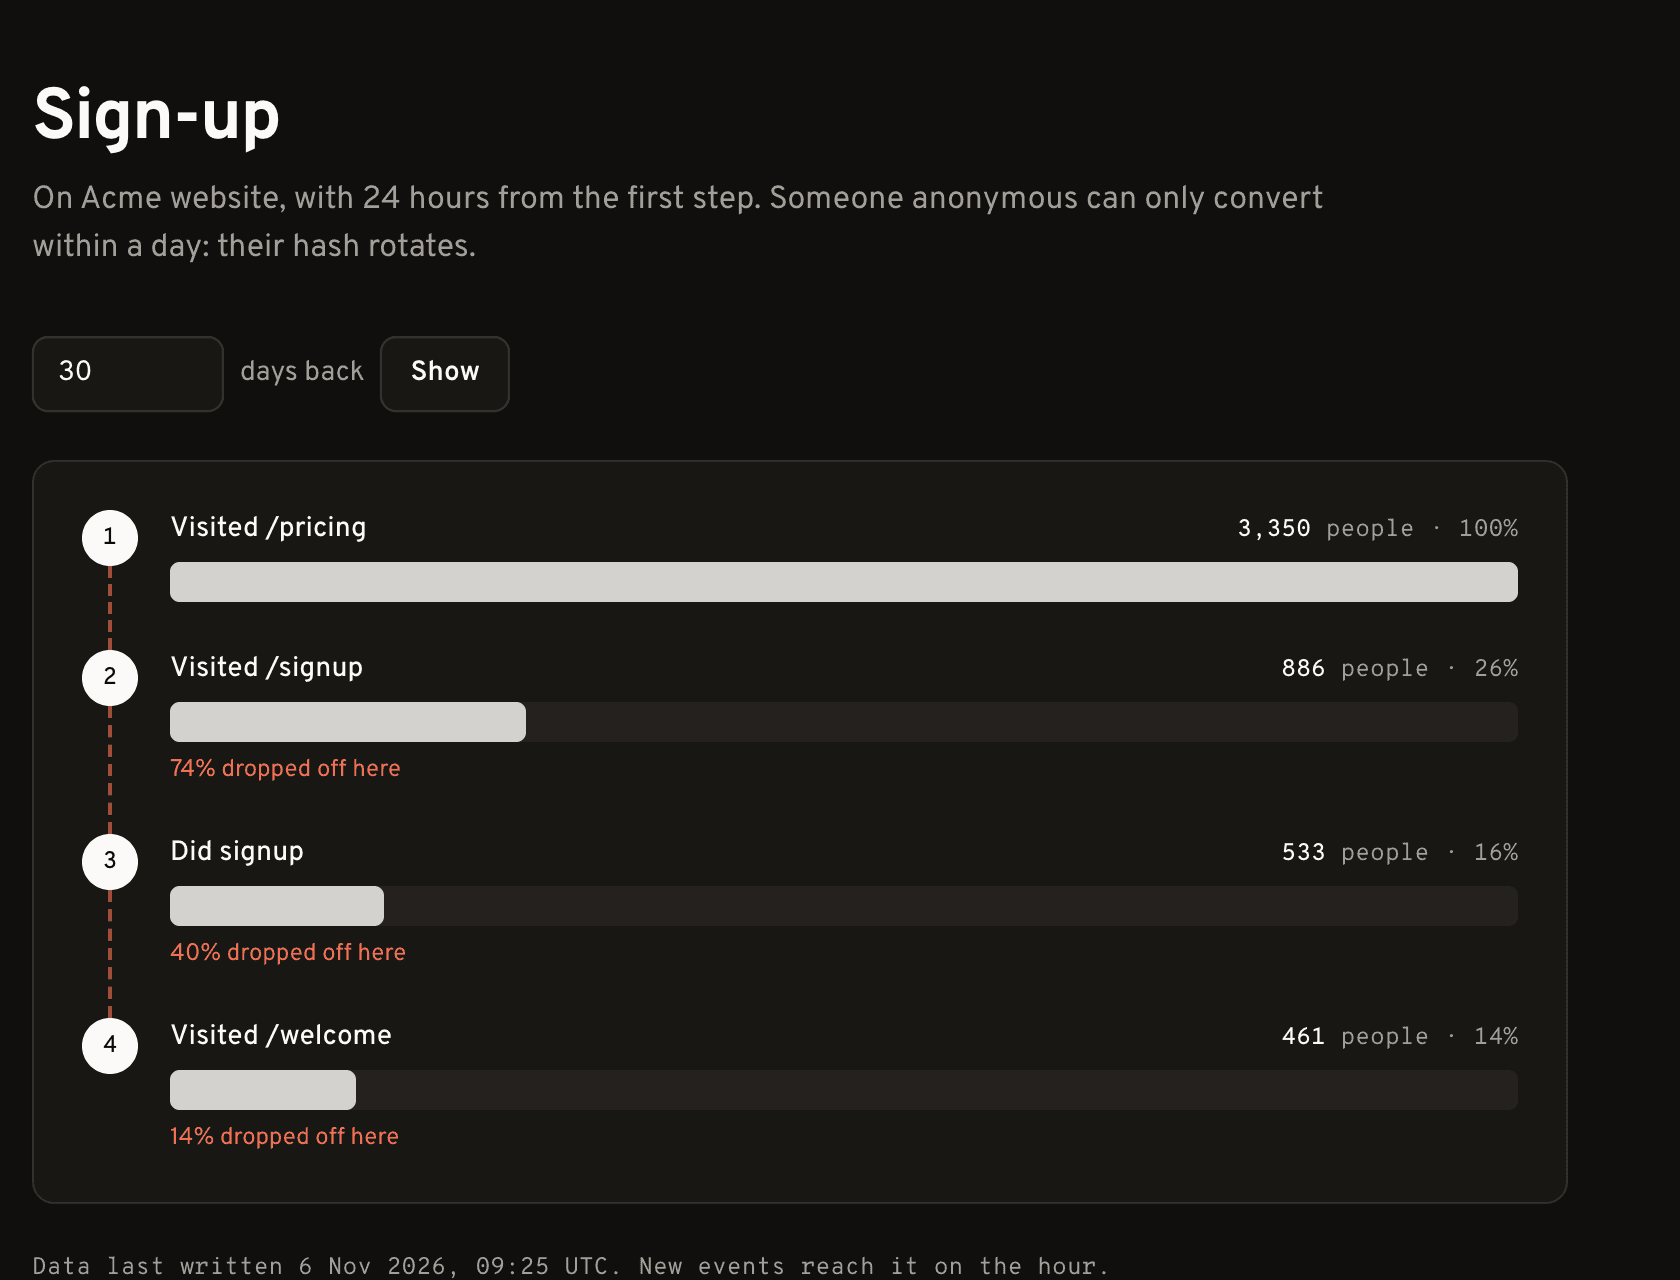
A real screen from the app. Acme and its figures are made up, on a throwaway database.
At /api/mcp, over streamable HTTP. An assistant registers itself, a member signs in and approves it, and every tool runs as that member. They only read, apart from create_site and create_workspace.
GET /api/v1/figures with a key holding the figures:read scope: per site and per day, counts only, no pages and no people.
POST /api/e checks the size, a signed key, the site’s domains, known bots and rate limits, then hands the batch to the buffer. Only what the buffer has kept is answered 202.
Each workspace’s batches go in one transaction: the ledger of batch ids, the events, the people, the day’s rollups. A batch written but not acknowledged is delivered again, finds its id, and adds nothing.
No extension. Raw events are partitioned by month and rollups stay until the site is deleted. Every table and partition carries row-level security, and a test fails on any that doesn’t.
None of this exists yet: session replay, automatic capture of every click, heatmaps, feature flags and A/B tests, surveys, account health. If you need one of these today, a more mature tool will serve you better. Section 9 of the spec